

NOVA Screener overview
How to use the free crypto screener: exchanges, spot and futures, timeframes, sort filters, the filter panel, chart badges and the extended chart with its measure tool.
NOVA Screener is a free crypto screener with live charts. Instead of one chart at a time, you get a grid of charts for the coins that matter right now, and the whole grid updates in real time. There is nothing to install and no sign up to start. Open novascreener.com and it works.
There are two ways to learn the main screen. Watch the two minute video below, or skip it and follow the written steps under it. Both cover the same ground, and every step here comes with a screenshot.
The top bar
Everything that changes what you see lives in the top bar. From left to right:
- Exchange: which exchange you are watching
- Market: spot or futures
- Timeframe: the candle size, from 1 minute to 1 day
- Sort filter: which coins make it into the grid
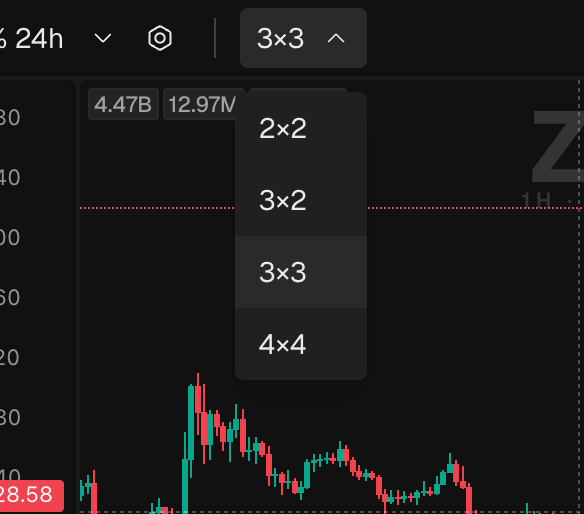
- Grid size: how many charts you see at once, from 2×2 to 4×4
Exchange
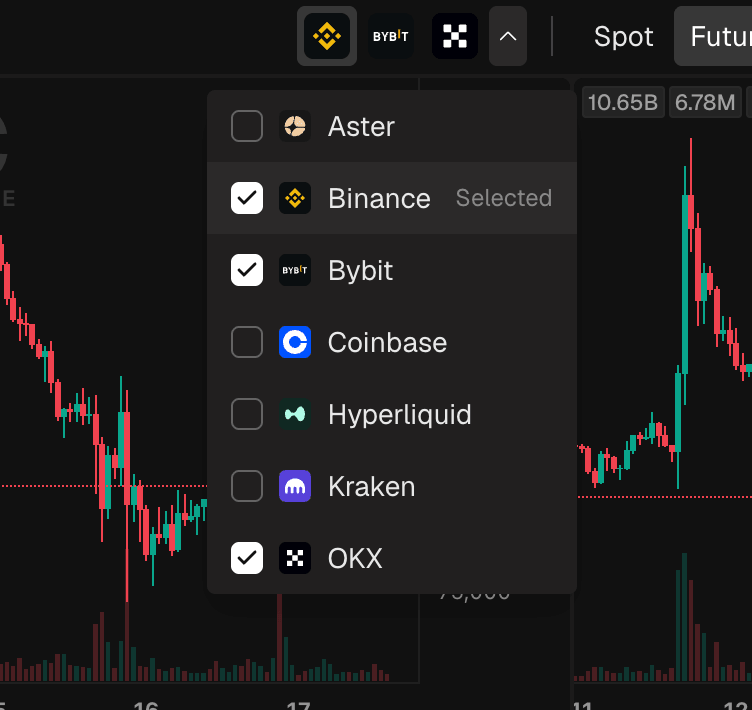
Click an exchange to watch it. To add or remove exchanges, open the dropdown next to the exchange icons and simply check or uncheck them. Only the exchanges you check stay in the bar, so the bar stays short and you switch between your exchanges with one click.
Tip: keep only the exchanges you actually trade on in the bar. Fewer icons, faster switching.
Market: spot or futures
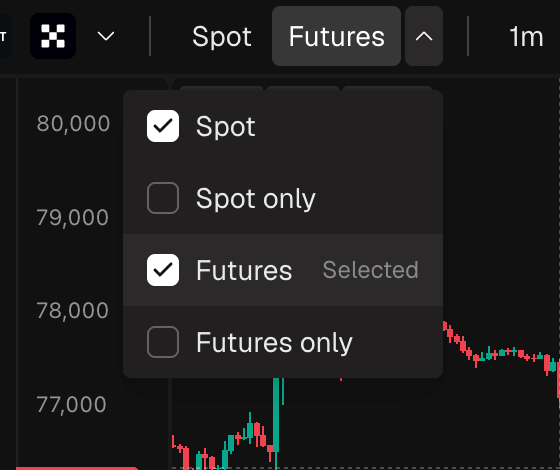
Next is the market selector. It has four options:
- Spot: spot pairs
- Futures: futures pairs
- Spot only: coins traded on spot that have no futures pair on that exchange
- Futures only: the other way around
The two "only" modes are useful when you want coins that exist in one market only, for example new listings that have not reached futures yet.
Timeframes
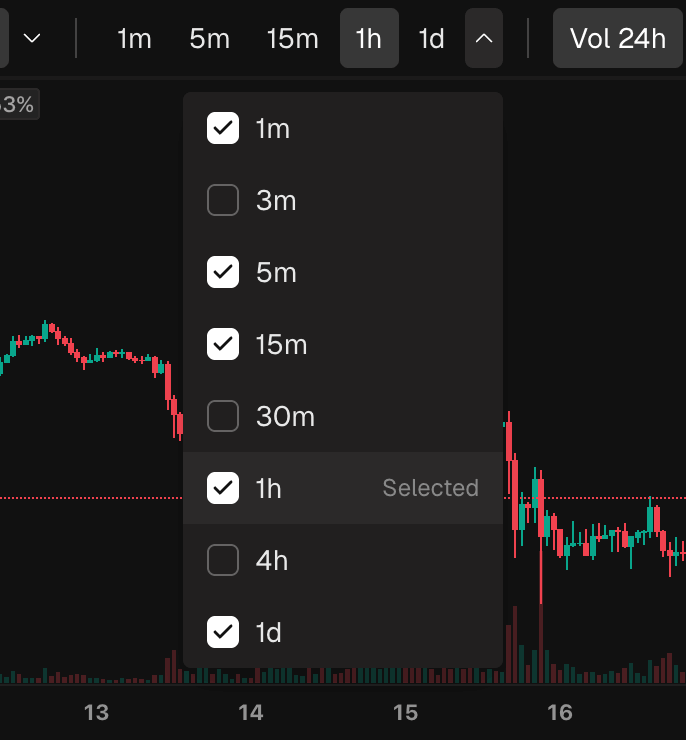
NOVA Screener has 8 timeframes:
- Short term:
1m,3m,5m - Medium term:
15m,30m,1h - Long term:
4h,1d
The dropdown works the same way as the exchange one. Check the timeframes you use, then click to switch between them. Switching is instant: the grid does not reload, it just redraws with the new candles.
Tip: scalpers usually keep
1m,5mand15mchecked, swing traders1h,4hand1d. Everything else only takes space in the bar.
Sort filters
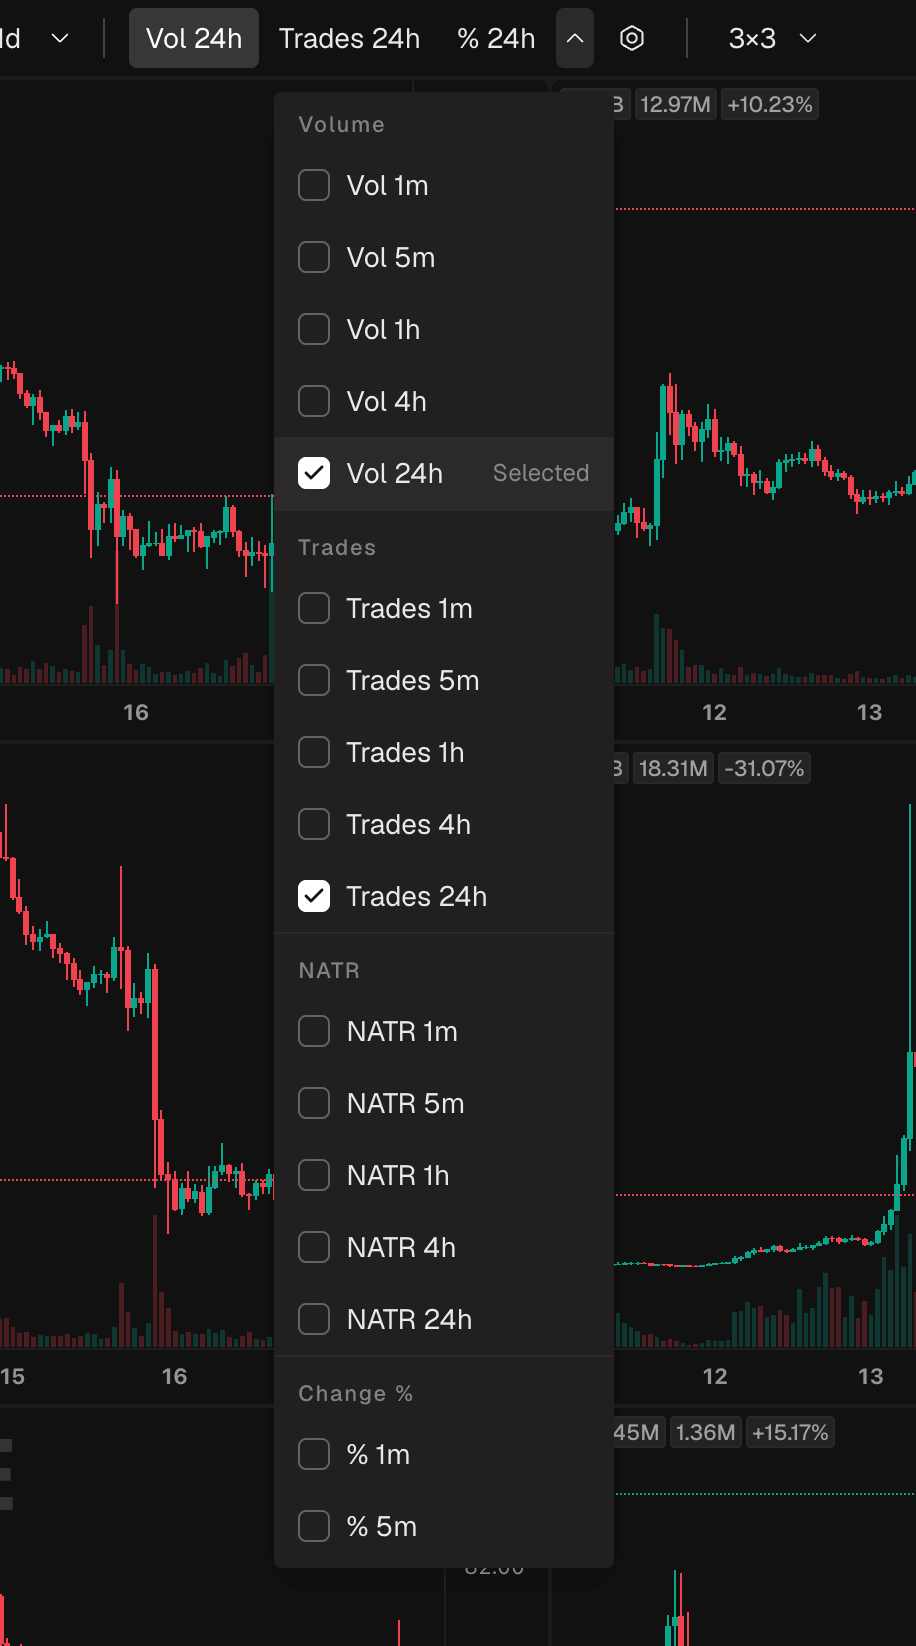
This is the most important control on the screen. The sort filter decides which coins you see. The grid always shows the top coins for the metric you picked, so the screen is never random. It is always the leaders by something.
There are 29 sort filters in five families:
| Family | What it ranks by |
|---|---|
| Volume | traded volume in the time window |
| Trades | number of trades in the time window |
| Change | price change in percent |
| Volatility | the size of the price swings |
| Spikes | a sudden jump in volume or trades compared with the recent average |
Each family comes in several time windows, from the last minute up to the last 24 hours.
A quick example. Pick volume spike 1m and the grid rearranges to the coins where volume just jumped. This is how you catch a move while it is still happening, without scrolling through hundreds of coins.
Tip: spike filters are the fastest way to see what is moving right now. Combine them with a minimum 24 hour volume in the filter panel, so thin coins with one random trade do not fill your grid.
Grid size
The last dropdown in the top bar sets how many charts you see at once: 2×2, 3×2, 3×3 or 4×4, that is 4, 6, 9 or 16 charts.
- Fewer charts: bigger charts, easier to read a single coin.
- More charts: a wider view of the market at a glance.
The filter panel
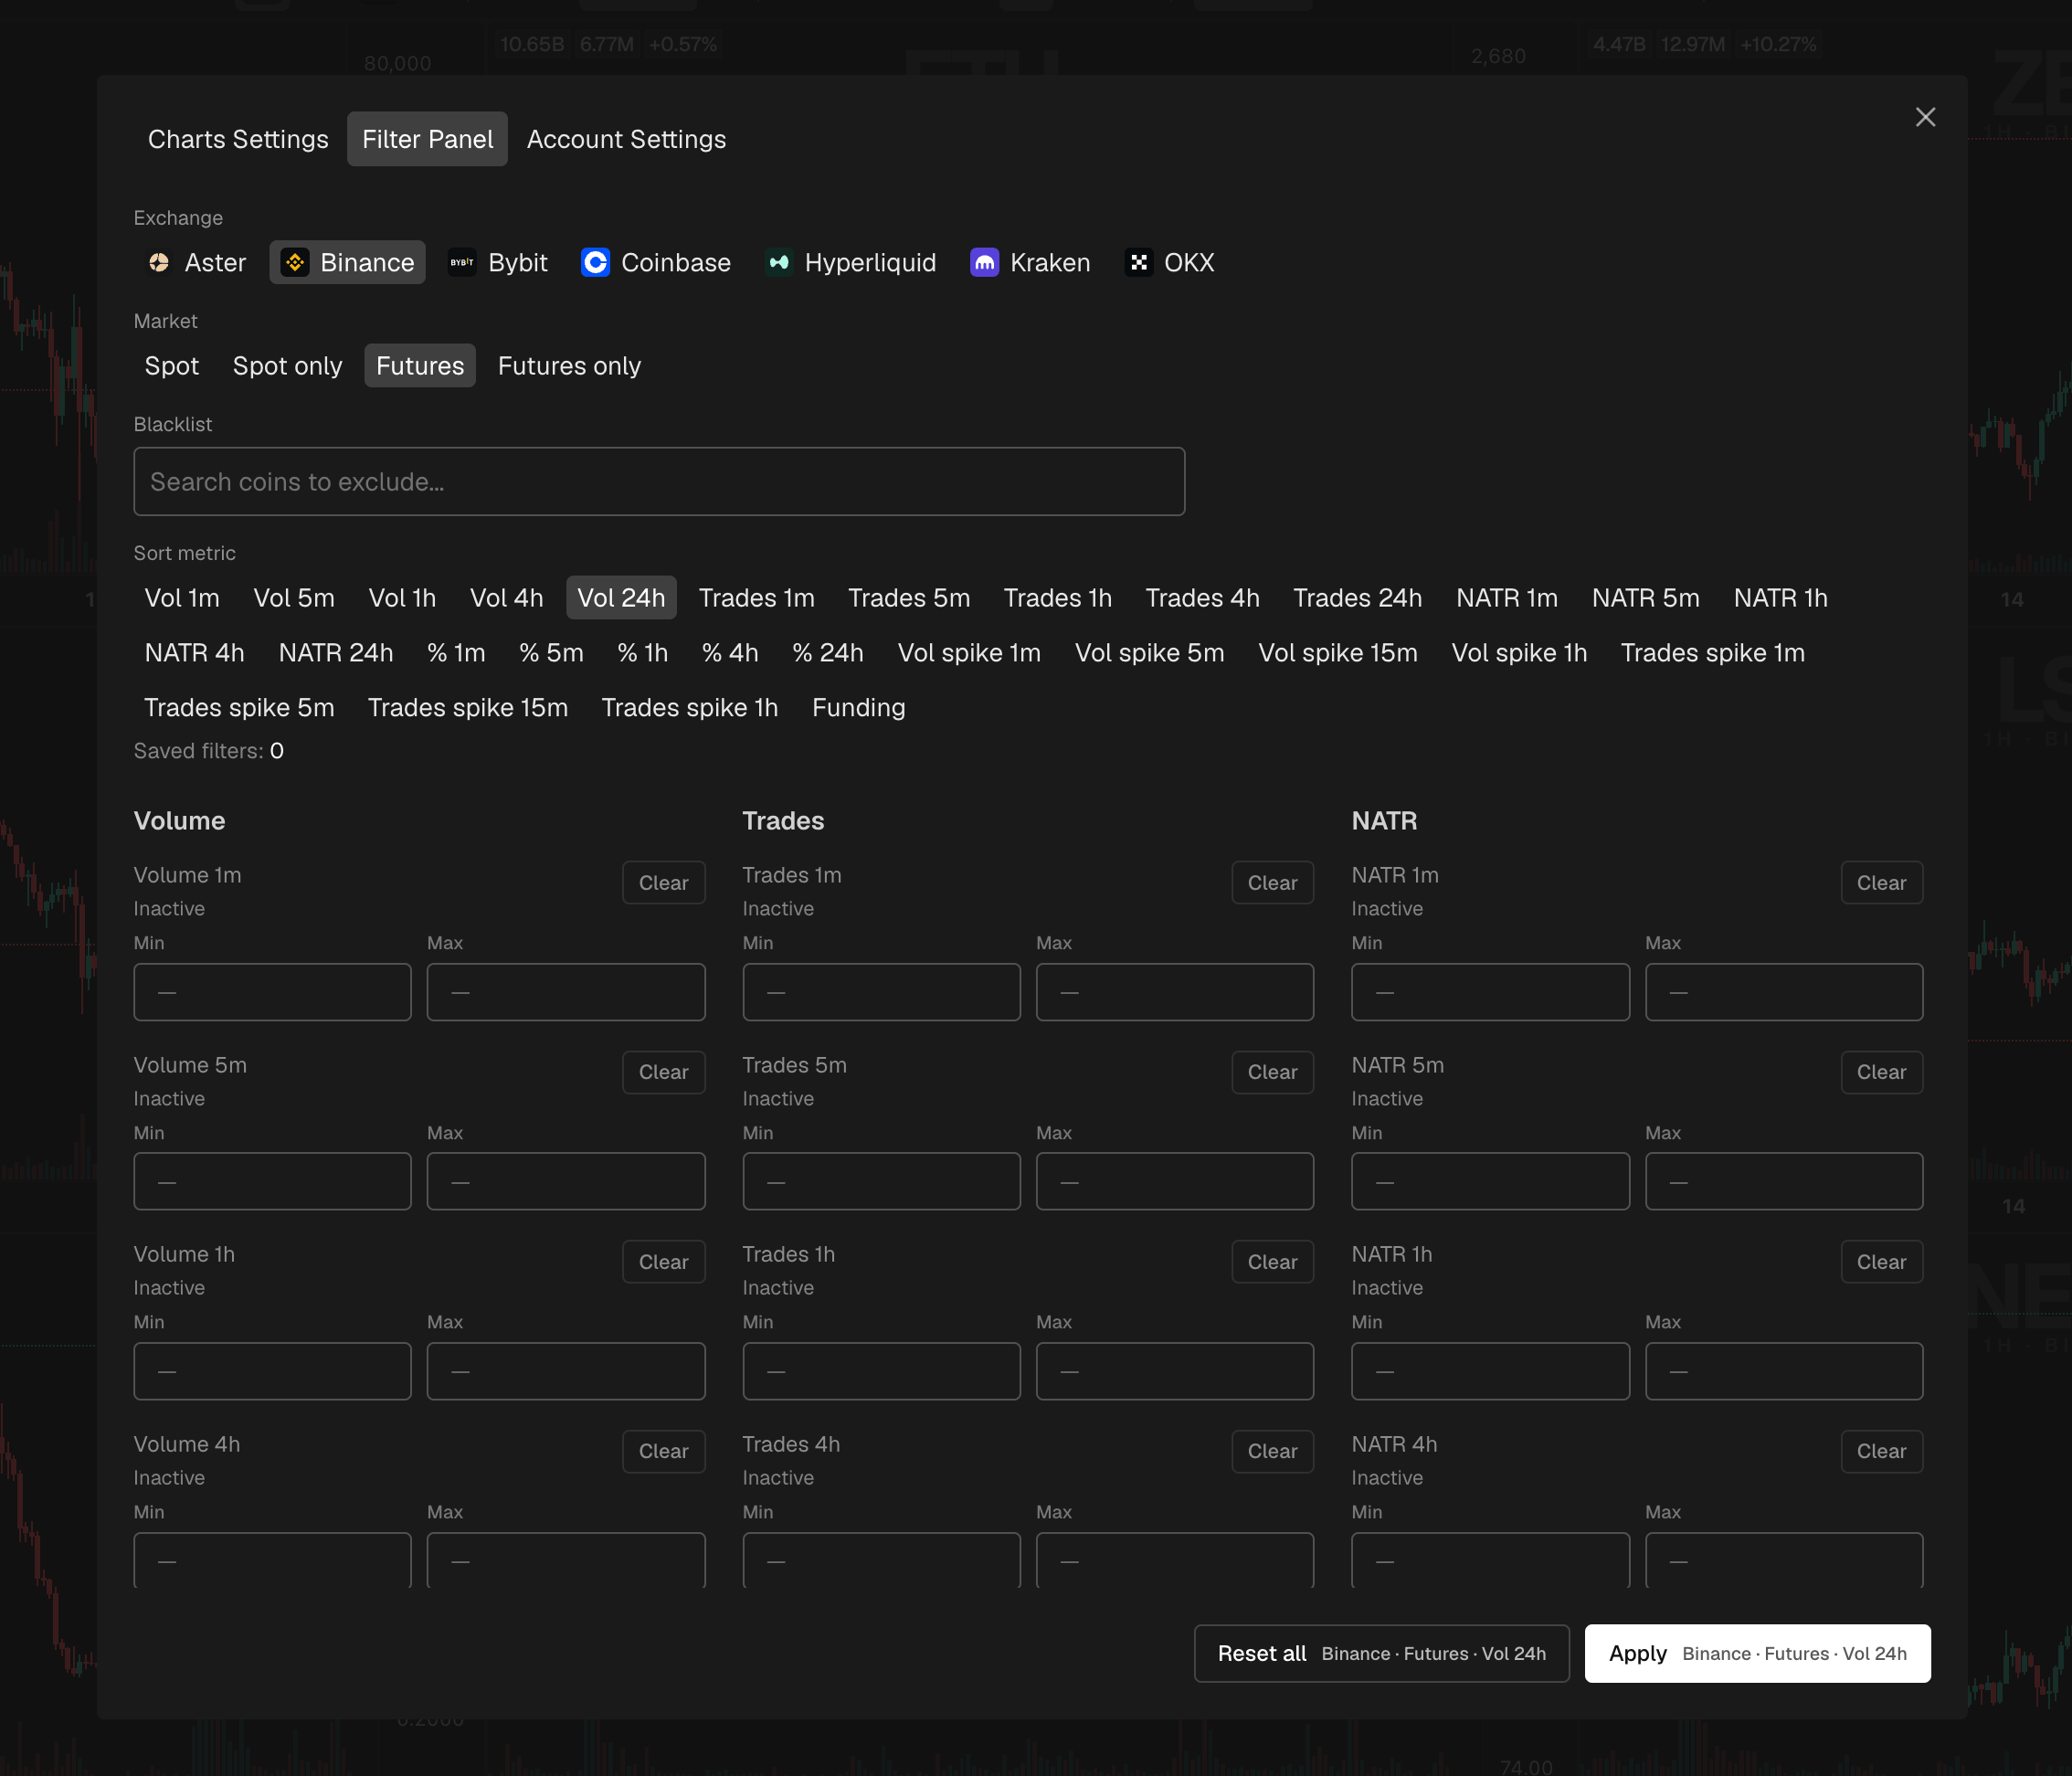
The gear icon opens the filter panel. This is where you narrow the grid down.
At the top you choose the exchange, the market and the sort metric, the same things as in the top bar. Below that you set a minimum and a maximum value for any metric. Two examples:
- A minimum 24 hour volume, to hide coins that barely trade.
- A minimum price change, to only see coins that are actually moving.
The logic is always the same: filters first, sort second. All active filters are applied, and then what is left is sorted by the filter you picked in the top bar.
Blacklist
The filter panel also has a blacklist. Add tickers you never want to see, and they disappear from the grid for that exchange and market.
Tip: the blacklist is the fix for coins that keep showing up in your filters for the wrong reasons, like a stablecoin pair with huge volume and no price movement.

Chart badges
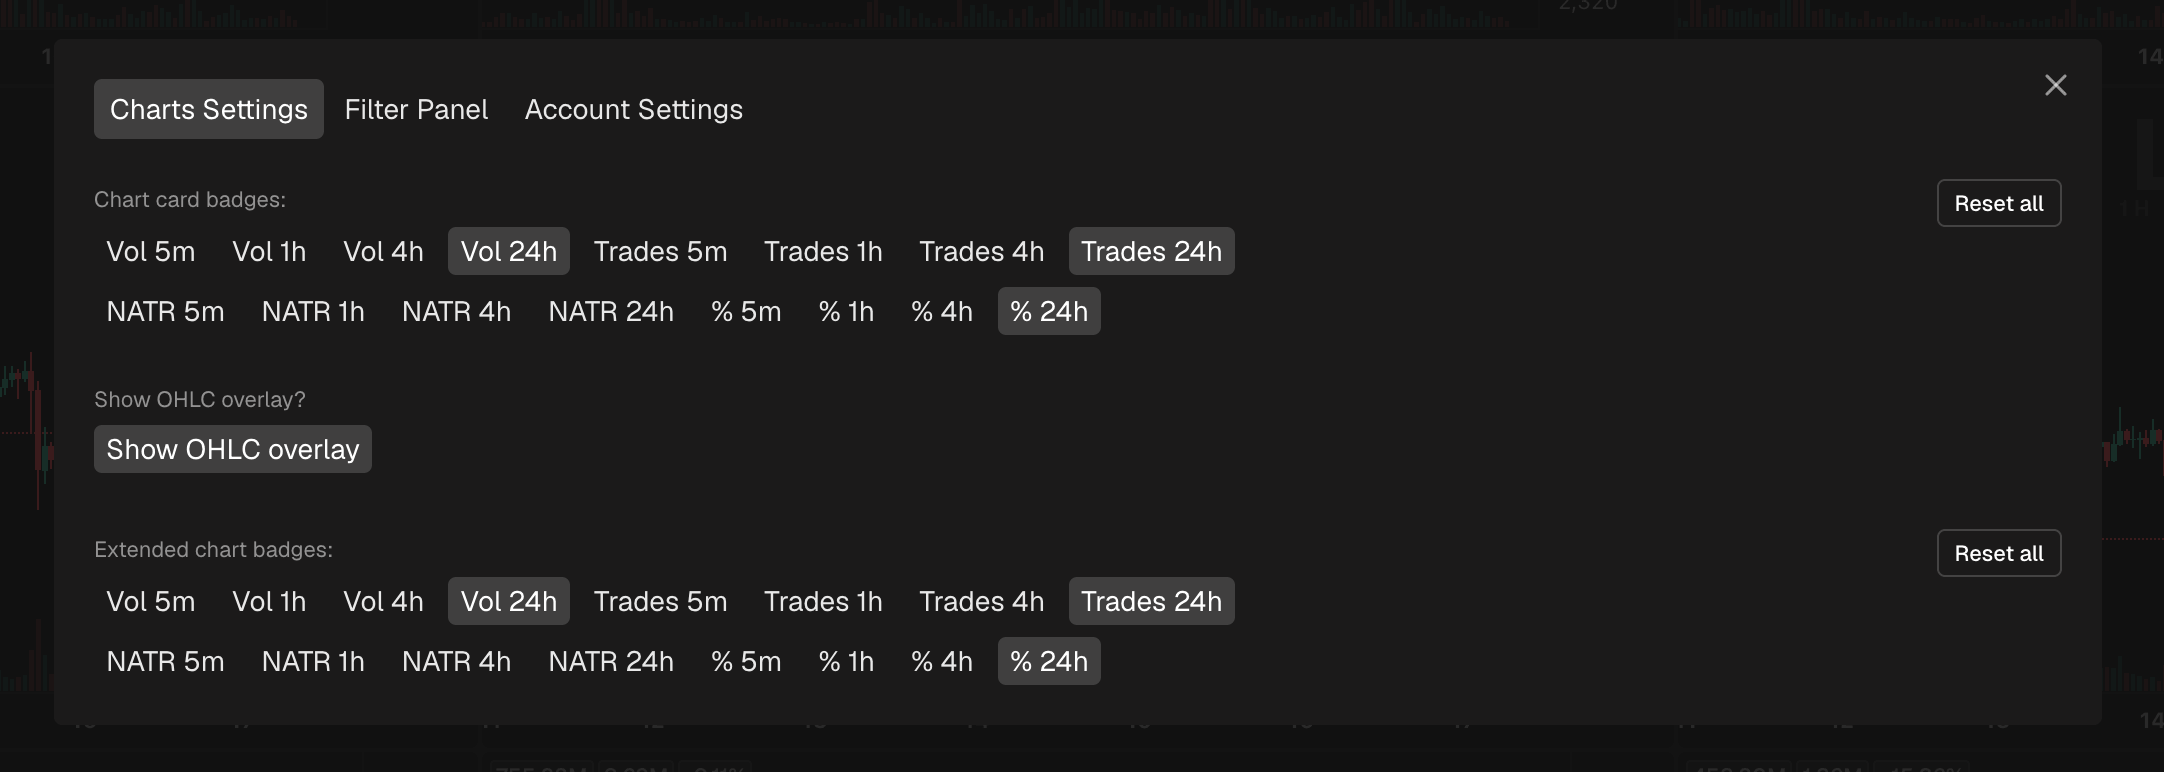
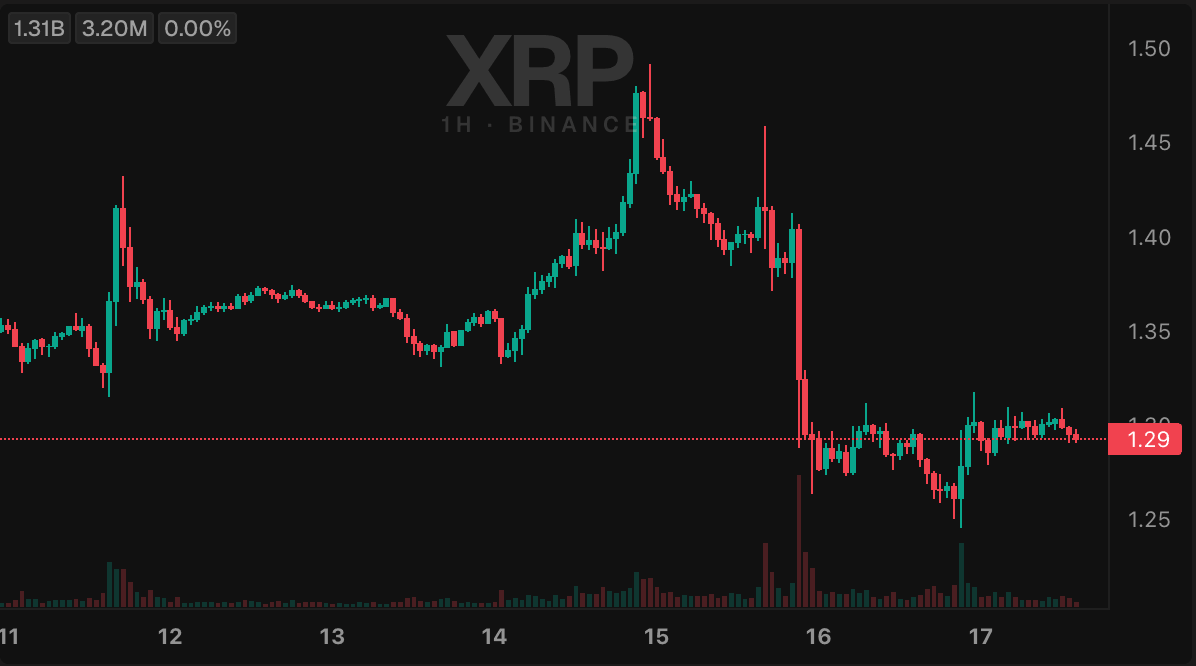
Every chart has small data labels in its corner. These are the chart badges. They show numbers like volume, number of trades or price change, so you can read the key figures without opening the chart.
You choose which badges to show in Settings, on the Charts Settings tab. Grid charts and the extended chart have separate badge sets, so you can keep the small charts clean and show more detail on the big one.
The chart grid
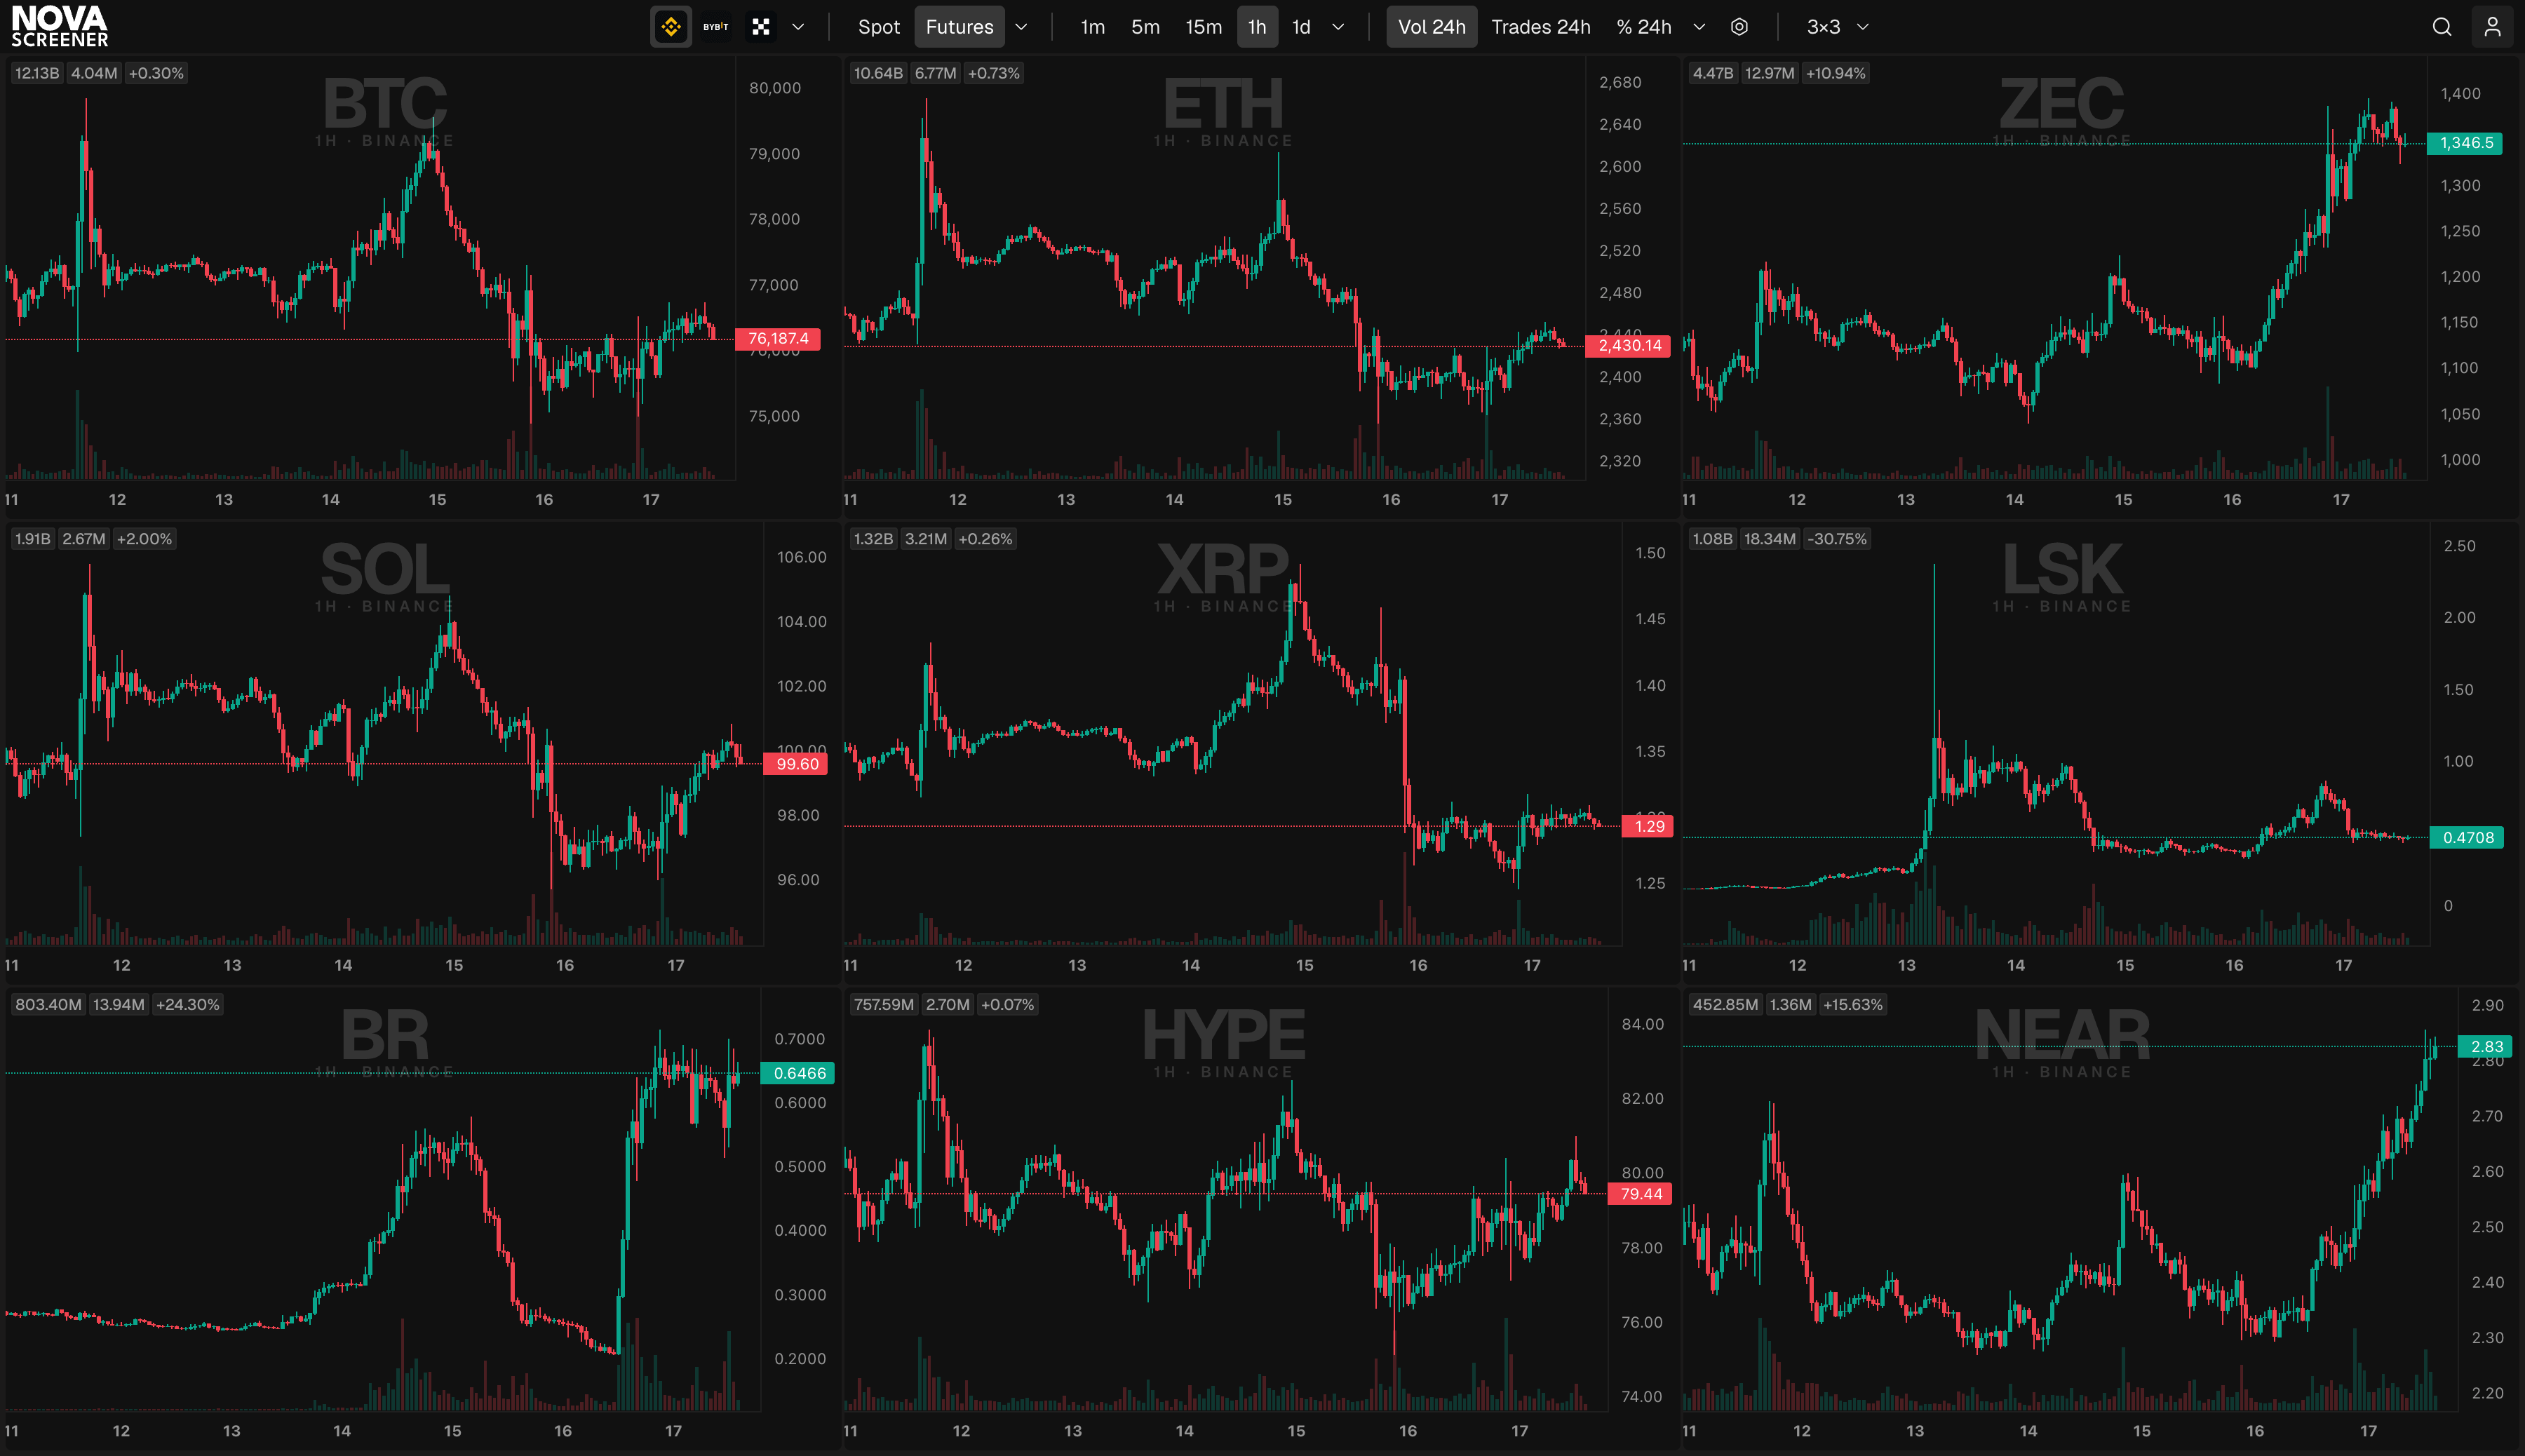
Now the main part of the screen. Every chart in the grid shows live data. Candles update as trades happen, and the badges and the current price update with them.
Two mouse actions matter here:
- Left click on a chart copies the ticker name. Handy when you want to open the same coin on your exchange: click, switch to your exchange, paste.
- Right click on a chart opens the extended chart.
The extended chart
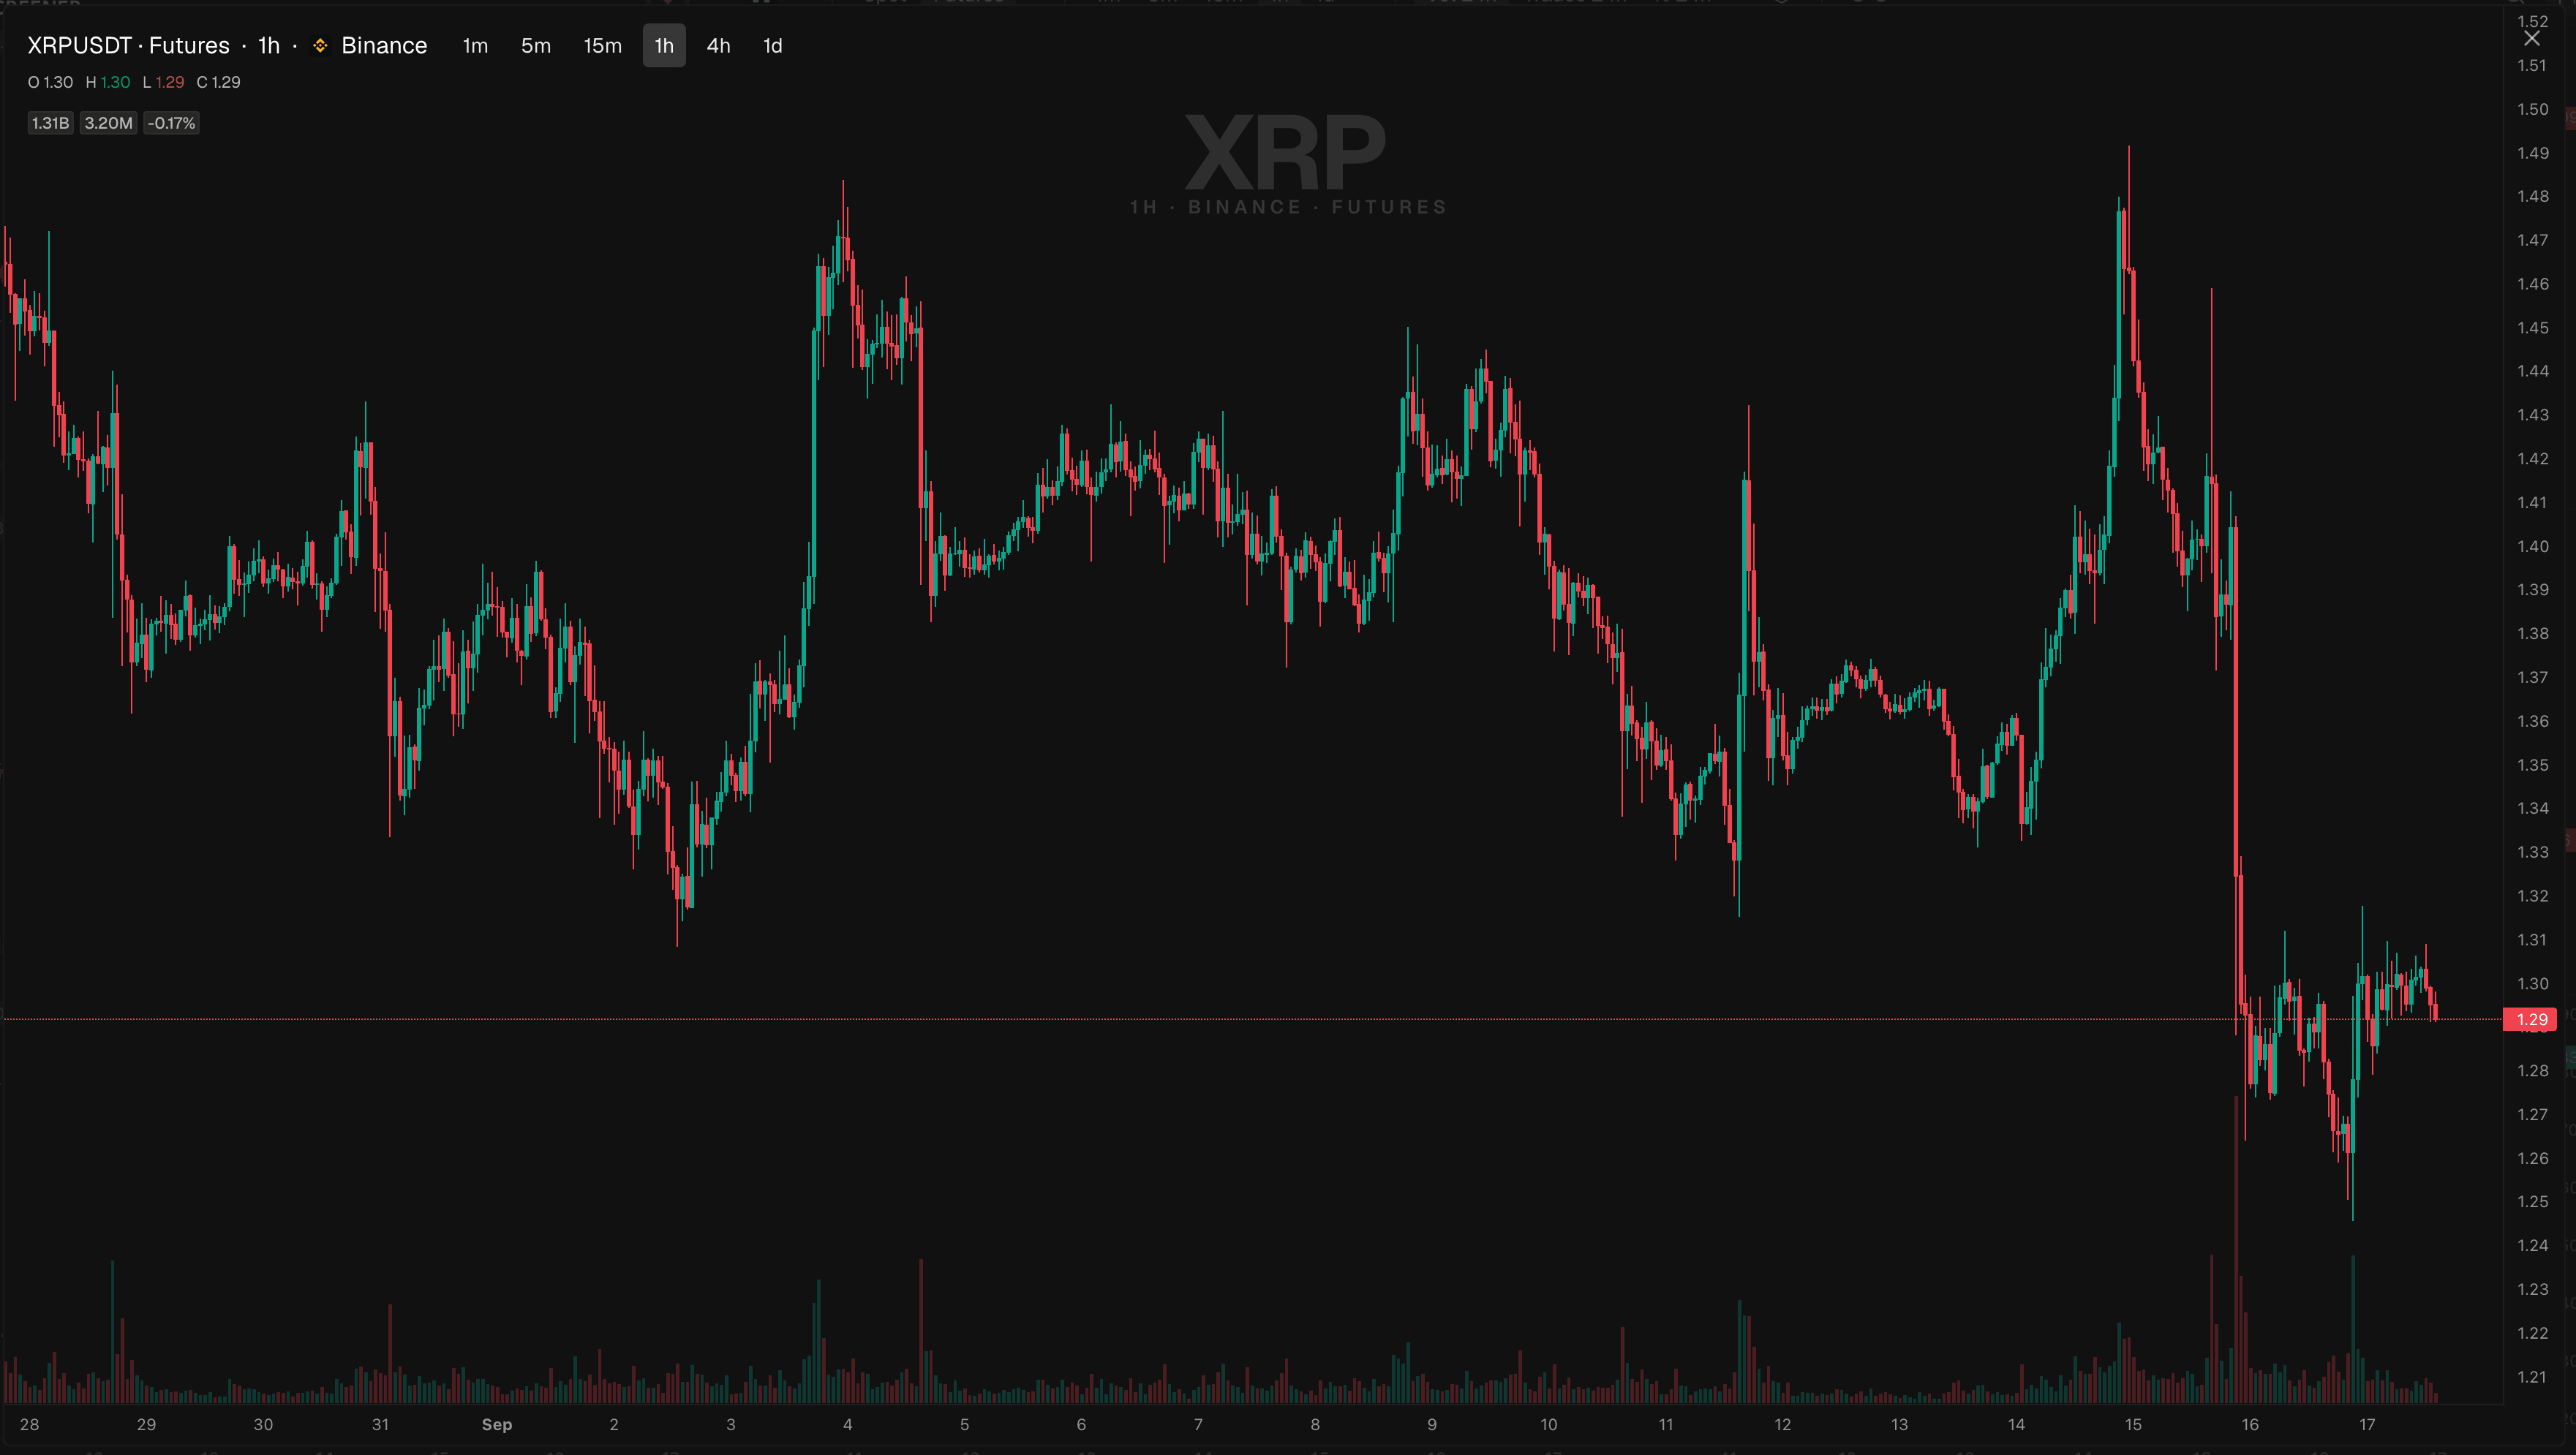
The extended chart is where you take a closer look at one coin. It opens with a long history and fills the screen.
- Switch timeframes right here. The chart reloads for the new timeframe in a moment.
- Scroll left and older history loads automatically, as far back as the exchange keeps data.
- Set a price alert at any level with the alert button. Price alerts have their own guide.
The measure tool
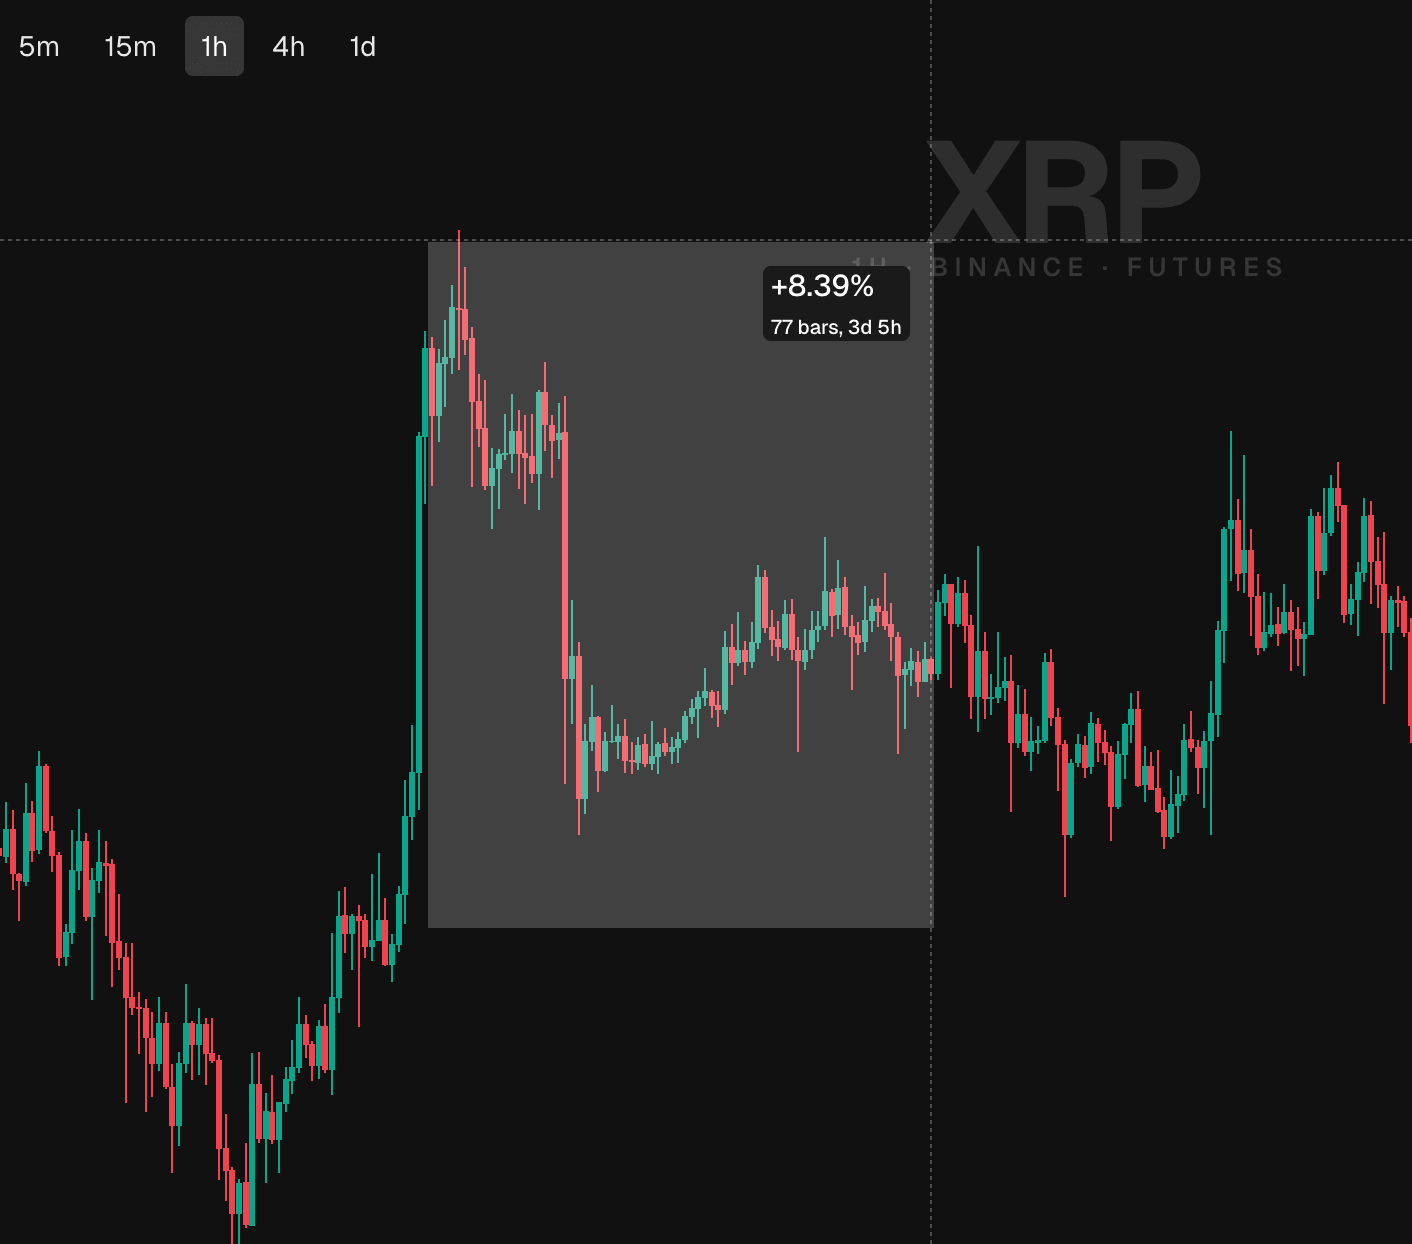
You can also measure any move. Hold the Shift key and move the mouse over the chart. A measure box follows the cursor and shows the price change in percent between the anchor point and the cursor. Release Shift and it is gone. No clicks, no drawing tools to clean up.
Tip: measure from the start of a spike to the current price. It shows how much of the move is already gone before you enter.
Languages and theme
NOVA Screener is available in 11 languages and has a dark and a light theme. Both are in Settings. The language and the theme are saved in your browser, so you set them once.
Frequently asked questions
Is NOVA Screener free?
Yes. The screener, the monitor and the alerts are free.
Do I need an account?
Not for the screener. It works the moment you open the site. You only log in for personal features like price alerts and complex alerts, so they are saved to your account.
How fast is the data?
It is live. Charts, badges and prices update in real time as trades happen on the exchange, not on a refresh timer.
Which exchanges are supported?
Several major exchanges, with spot and futures markets. The full list is in the exchange dropdown, and it keeps growing.